QSOs, some BL Lac objects, and the most powerful radio galaxies (at their
redshift distances, which is an issue we've dealt with already) are luminous
enough to be
detected at large lookback times (beyond 80% of the Hubble time these days)
and with path lengths long enough to offer attractive cosmological probes.
Since (as far as we can see) they are active nuclei (of galaxies), we
might also hope to use them as indirect indicators of galaxy evolution, and
as background light sources for absorption-line studies of galaxy disks and
intergalactic clouds. Major tests that have been applied include
Redshift evolution of the population of QSO absorption systems
We deal here with space densities in comoving coordinates, so that the
(1+z)³ due to the Hubble expansion is factored out.
Number counts: For any set of sources with the same
luminosity L and constant space density
r,
in the approximation of
flat spacetime the observed distribution of fluxes S will have the number
of sources brighter than S given by
N(> S) ~ S-3/2
or
log N(> S) = const - 1.5 log S
which is why one reads of a log N - log S relation. Since this holds for
any individual value of L, it is also true for any non-evolving luminosity
function
F(L).
This may be applied without redshift information, so that
it has been done effectively for extragalactic radio sources over a range
exceeding five orders of magnitude in flux. Independent of one's redshift
model, substantial changes in the luminosity function or space density of
quasars and radio galaxies have occurred. This is demonstrated by the
plot from Windhorst et al (1993, Fig. 3 from ApJ 405, 498, courtesy AAS),
shown in the typical fashion
normalized to the Euclidean expectation (slope 2.5 because these are
differential rather than integral counts) to highlight departures:
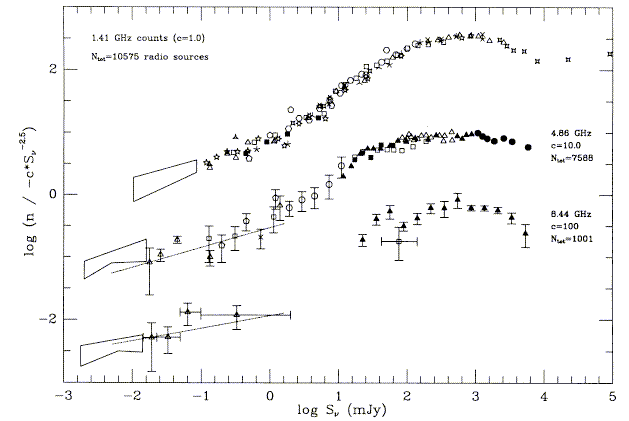
The important features are (1) an initial rise from the very
highest fluxes (too many faint sources), (2) a strong drop as one goes
fainter (can be modelled by source evolution), and (3) another excess of
very weak sources (possibly a different population, including starbursts
and normal spirals; what Condon has called the dregs of the universe).
Identifications of very weak radio sources at faint optical
levels suggest that interaction-triggered starbursts at moderate
redshift start to dominate at these levels (Windhorst et al. 1995
Nature 375, 471).
Much of the power of source counts is in telling that something has
changed over cosmic time, independent of any but the most general
assumptions (we don't need thousands of redshifts, for example). One must be
able to assemble certifiably complete samples, which is tough for optical
data. Also, just what changes may be quite model-dependent. The distinction
between evolution of the source population in density and in luminosity may
be quite subtle, though it has markedly different physical consequences.
Also one might deal with evolution in duty cycle, if AGN are a stage that
much of the galaxy population goes through for some fraction of the
time; the consequences of different duty cycle might be manifested in the
mass function of central black holes today.
The SchmidtV/Vm test (ApJ 151, 393, 1968)
uses the fact
that any selection technique has some limiting flux or magnitude, and that
we would ordinarily expect to find objects anywhere within the associated
volume unless they occur preferentially at larger distances (greater
lookback times). If we see individual objects at distances Robs
and
expect to detect them to Rlimit, then for a
nonevolving population we
would have the quantity
V/Vm = (Robs/Rlimit)³
uniformly distributed from 0 to 1 for whole samples. Any error in
the assumed limiting
magnitude can only reduce the mean value. Observed samples of QSOs give
V/Vm = 0.51 - 0.66, so there must be a real local
decrease in quasar
number density. In practice, various corrections for color and
emission-line properties are necessary (see Weedman chapter 6). Selection
effects such as having the wrong limiting flux can only make the mean value
of V/Vm less than 0.5, so that higher
values may be taken as either a
strong geometrical effect or evidence for some kind of evolution in the
luminosity function. If we were sure of our world model, we could use a
luminosity-distance formulation instead of simple r in calculating
V/Vm.
As set out by Schmidt 1968, we then use as a distance measure not just
cz/H0 but multiply this by

This and related techniques show a strong increase in the number of
luminous QSOs with increasing redshift up to about z=2.5, with the
comoving density varying approximately as (1+z)5.
Luminosity-function evolution. We would really like to know
not only that something about the AGN population changes with cosmic time
(redshift), but what. It might be the total number of AGN, the
characteristic luminosity of each one, or the duty cycle of intermittent
activity - the fraction of time a typical object spends in an ``on" state.
One approach to sorting these out is to watch the luminosity function
change with redshift. There exist redshift-dependent selection effects in
optical surveys, so we need to sidestep these here. Most prominent are
those for color and objective-prism selection. Below redshifts of 0.4 or
so, QSOs almost uniformly appear much bluer than faint high-latitude
stars. At z~0.4, Mg II
l 2798
emission leaves the U band
and makes QSO colors less distinct. Similarly, at very high redshifts Lyman
a
emission dominates; as soon as it passes the bluer passband of a
pair QSOs become quite red. Multicolor selection reduces confusion with
stars, but there remains nonuniform selection probability with redshift
especially for faint objects. Similar effects occur in objective-prism
surveys for emission-line objects; there are redshift ranges in which the
only accessible emission lines are rather weak and only the brightest (or
unusually strongest-lined) objects will be found.
To work around these problems, one might
(a) look at only a set of redshift ranges for which selection is very
efficient (Weedman ch. 6, Gaston 1983 ApJ 272, 411), or
(b) use complete magnitude-limited samples and fit a model incorporating
known selection functions (Schmidt and Green 1983 ApJ 269, 352). Further
integral limits on the unseen part of the LF are provided by the diffuse
X-ray and extreme UV backgrounds (Olbers' paradox revisited - we don't see
quasars covering the sky either). Results indicate that the shape of the LF
doesn't change much except at low luminosities, but that there are far
fewer QSOs now than there were at z=2.5.
There have been many attempts to extend our knowledge of QSO evolution to
higher redshifts. If galaxies are needed to host QSOs, the highest-redshift
QSOs would be telling us when galaxies have to have already formed, and
maybe what the rate of galaxy formation was. It is interesting (if not
slightly suspicious) that some QSOs at z~3 are not very faint
(visual magnitudes 16-18). The current redshift record is 5.80 (as of
November 2000 with the first round of SDSS objects, Fan et al.
2000 AJ 120, 1167). Objects at
redshifts above 4 have been found via multicolor
searches, slitless spectroscopy, and incredibly in one case
by sheer accident while observing an unrelated radio galaxy.
There are still far too few high-redshift AGN to continue the trend seen up
to z~2.5, something happened to the QSO population. This might
have been
an effect of opacity in the IGM or intervening galaxies
Up to redshift 2.5, the main effects are of increasing number and
flattening toward higher luminosities, shown in fig. 4 of Schmidt and
Green (courtesy of the AAS):
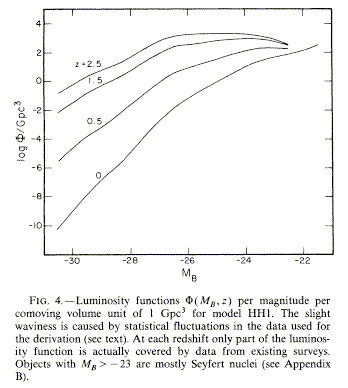
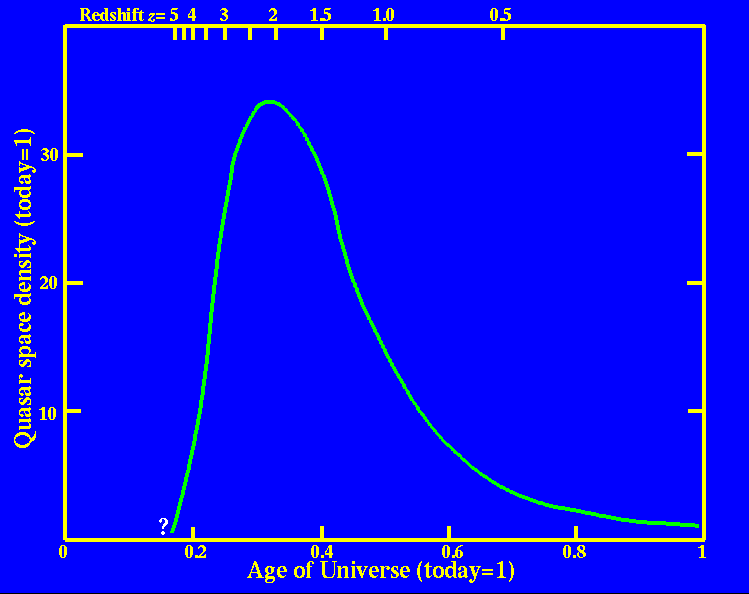
This schematic behavior has held up in later studies,
while at higher redshift the observed numbers are increasingly deficient
compared to extrapolations of this behavior. This has been reviewed by,
for example, Shaver et al. 1996 Nature 384, 449) from which the
following plot was adapted:
The implications of quasars at redshifts z> 4 have been
discussed by
Turner 1991 (AJ 101, 5), and are
only getting stronger as a few objects turn up at higher
and higher redshift. Generally, galaxies must have formed by z=5 or
even better z=10 to expect enough dense cores to make high-redshift
quasars. He cautions that beaming or gravitational amplification, if either
operates differently on this population than for other QSOs, would
complicate the analysis tremendously. There has been an explosion in the number
of high-redshift quasars known, with 104 listed above z=4.0
in the 9th edition of the
Veron-Cetty and Veron catalog. And this, of course, was before the
SDSS color-selected samples became available.
There is a serious worry about whether we can see many objects at these
pathlengths free of degradation by intervening material (via
dust extinction, Lyman-limit absorbers, or the accumulation of
narrow
Lyman-a
lines)
or gravitational
distortion, and thus about whether what we see is what we get. Heisler and
Ostriker (1988 ApJ 332, 543) looked at the effects of dust in intervening
galaxies. Virtually all high-redshift objects are seen through the disks of
several foreground galaxies (a.k.a. metal-absorption-line systems) which
might contain significant dust. This would have the effect of hiding very
distant objects (optical depth
t ~
(1+z)2.5). In flux-limited
samples, we would have missing rather than reddened objects. A key test
here is whether there are enough faint radio sources to be the obscured
QSOs, and whether there are many optically unidentified X-ray sources of
appropriate flux. Also, at longer path lengths the probability of gravitational amplification goes up, since there is more spacetime volume for lens
galaxies to be effective (they work best about midway in proper distance
between the QSO and us). It seems clear that such effects
contaminate QSO samples to
some extent, but probably not in a statistically significant way at least
to z~ 2; typical spiral-disk opacities today seem to be rather
less than they assumed (modesty forbids, but see ApJ 542, 761, 2000), and
would have been even smaller at the more relevant early epochs,
with fewer generations of massive stars to enrich the ISM.
In all these issues, there is a nontrivial transformation between
what we can trace - statistical changes in the source population -
and where this actually happens - physical properties of individual
objects. For example, on might consider that the luminosity function of
QSOs might change either by the objects as a class varying their
energy output (pure luminosity evolution) or by the
actual comoving density of objects above some threshold changing
(pure density evolution). This might in turn reflect a
different typical duty cycle or phase of accretion in the earlier Universe.
Cosmology with Active Nuclei as Probes
It has long been seductive to try probing the world model of
cosmology by trying to use AGN as standard candles or standard
measuring rods. Radio galaxies seen at 2.2 microns have a
very well-behaved Hubble diagram, and for a while it appeared that
radio QSOs with flat-spectrum core sources showed a neat relation
between luminosity and equivalent width of C IV
l
1549 emission (the Baldwin effect, as in Nature 273, 431, 1978,
which seems to have been
the result of sheer bad luck in object selection and has just
about gone away with recent data collections).
We can also use AGNs to probe the properties of galaxies along our line of
sight to them, galaxies that are in many cases individually impossible to
detect directly, by studying their influence on the propagation of light
from the distant AGN. This may be in the form of gravitational
lensing (which we've already treated) or absorption-line systems.
Aside from the Lyman
a forest,
these include metal-line systems,
damped Lyman
a
systems, and Lyman-limit systems. All three of these
are telling us about some kind of gas-rich galaxy. Much of the controversy
is how we are to associate them with the sorts of galaxies seen in our
neighborhood to derive evolutionary changes.
Metal-line systems have been reviewed in several chapters of
QSO Absorption Lines: Probing the Universe, and are considered
important enough to have driven one of the few initial Key Projects for HST.
Various
species are seen in absorption depending on the absorber redshift
zabs < zem: Lyman
a,
Mg I, Mg II, Fe II, C I, C IV, various
species of Si, N, O. Complex velocity structure may be present; sometimes
associated H I absorption at (1+z) × 21 cm may be found. The column
densities involved are hard to assess because of uncertainties in
ionization structure. Some similarity is found with the hot ISM in our
galactic halo, but we sample different regions for these kinds of
observations and the ionization match is still poor. There is some evidence
that the absorbers are starburst galaxies because (1) there is a problem
with spatial extent for normal galaxies, and starbursts are known to blow
gas away in winds, and (2) the ambient QSO UV radiation field is not strong
enough to ionize the gas as strongly as the absorption-line ionization
levels suggest. In fact, the nearby galaxies identified with QSO absorption
lines of Ca II and Na I are systematically high in SFR for their
morphological types (Caulet and Keel, should have been published years ago).
Also, objects at intermediate redshift z~ 0.5 for which Mg II can
be seen from the ground and optical identification is possible look like
some sort of starbursts. It is still not clear whether we are dealing with
dwarf or luminous galaxies as the dominant absorbers. The evolution in
comoving density with redshift is at most mild, unlike the Lyman
a
forest (essentially metal-free) systems.
Damped Lyman
a
systems} have much higher column
densities in absorption, so that the H I resonance line is in a different
part of the curve of growth. These are taken to be genuine disk galaxies,
and extensive surveys (for example Wolfe et al 1986 ApJSupp 61, 249)
have been carried out in hopes of watching spiral
disks evolve. Straightforward assumptions indicate that these contain
most of the neutral gas in teh Universe for a wide range of redshift.
Metal lines are associated with these systems as well. A
sample is shown by Turnshek et al 1989 ApJ 344, 567, by permission
of the AAS):
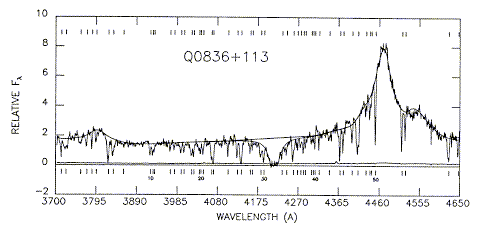
Note the broad Lyman
a
absorption trough. A fascinating recent
finding is that the metal abundances in these systems increase
systematically with cosmic time, although they do not reach the levels
seen in galactic stars of similar age (Lu et al. 1996 ApJSuppl 107, 475).
Many of these are also Lyman-limit systems, in which the optical
depth at the Lyman edge is unity or greater. These are recognized by a
step down in flux at the Lyman edge at the absorber (not QSO) redshift,
frequently to zero detectable flux. The Milky Way is a Lyman limit
absorber from our vantage point in every dirction at z=0.
Various treatments are given by Tytler
(1982 Nature 298, 427), Bechtold et al 1984 (ApJ 281, 76) and Lanzetta
(1988 ApJ 332, 96). An example is shown by Sargent, Steidel, and
Boksenberg (1989, ApJSuppl 69, 703, courtesy of the AAS):
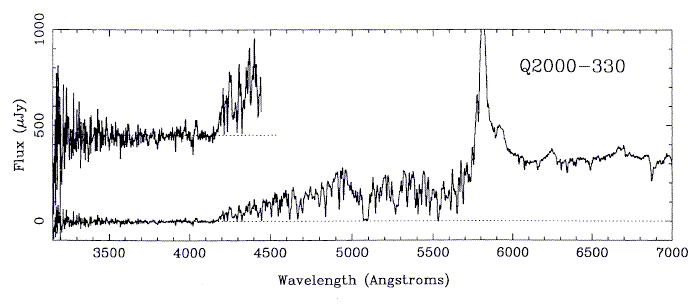
Lanzetta found that these systems seem to have constant comoving space
density, and that the Mg II metal-line systems seem to be disappearing
relative to Lyman-limit systems.
These systems may also be sought in BL Lac objects, avoiding confusion with
emission-line or BAL structure but introducing the problem that we may
not know the AGN redshift except as the redshift at which the Lyman
a
forest disappears.
« Alternate views of AGN
| Evolution of galaxies »
Course Home |
Bill Keel's Home Page |
Image Usage and Copyright Info |
UA Astronomy
keel@bildad.astr.ua.edu
Last changes: 11/2000 © 2000


