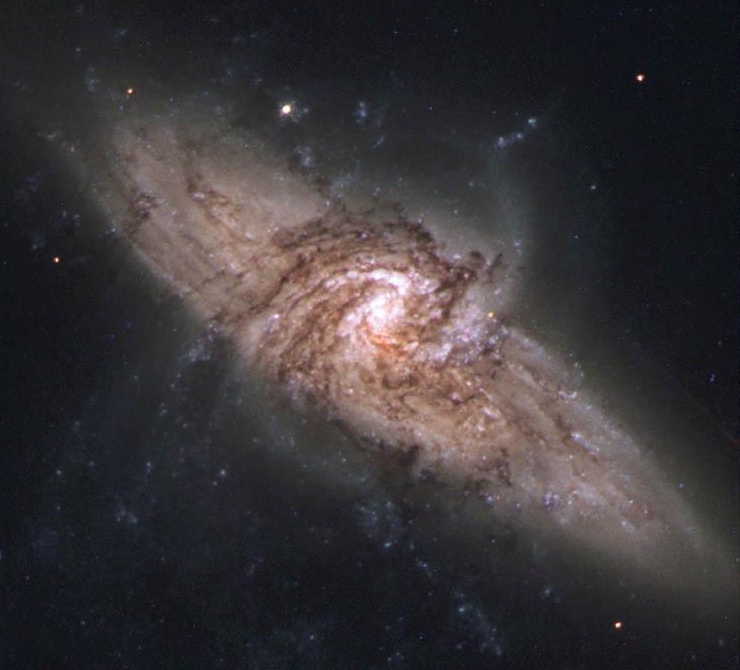
All right, surely you didn't expect me to pass up putting that particular image here, did you?
 The effects of absorbing material in
galaxies were recognized before the physical nature of galaxies became clear.
A study by H.D. Curtis published in 1918 (sadly, our library doesn't have
the Lick Observatory Bulletins from that time) compared photographs of
spirals in an obvious inclination sequence, showing that a band of obscuring
material lies in the disk plane. A cheap replica of this demonstration
is shown in the sequence at right, taken with the same venerable
Crossley telescope
in the 1980s (using much lower contrast plates and with San Jose much
brighter), but it makes the point anyway.
The effects of absorbing material in
galaxies were recognized before the physical nature of galaxies became clear.
A study by H.D. Curtis published in 1918 (sadly, our library doesn't have
the Lick Observatory Bulletins from that time) compared photographs of
spirals in an obvious inclination sequence, showing that a band of obscuring
material lies in the disk plane. A cheap replica of this demonstration
is shown in the sequence at right, taken with the same venerable
Crossley telescope
in the 1980s (using much lower contrast plates and with San Jose much
brighter), but it makes the point anyway.
It became clear, especially from comparing with nearby edge-on systems such as NGC 891, that this layer is exactly what we see in our view of the Milky Way (as shown in the magnificent Lund all-sky mosaic. Compare to the NOT image of NGC 891 shown below, taken in red light. Looking from the outside in through the whole disk, dust absorbs virtually all the visible light from the center (which is why it's so hard to see the Galactic Center), and shows an intricate level of cloud and filament structure. It turns out that dust is a useful first proxy for phases of the interstellar medium that are harder to trace, since cool gas and dust are coupled gravitationally and through the drag of atom/grain collisions.
Dust has been observed in two guises - optical/UV absorption and far-IR emission. Much of what (little) we know about its grain properties comes from analysis of the extinction curve - the normalized amount of extinction as a function of wavelength, such as derived from looking at pairs of stellar spectra with very similar temperatures but different foreground extinctions. The general extinction curve within each of the Milky Way, LMC, and SMC is fairly well defined, with some local excursions in star-forming regions and pronounced differences in the UV among the three. In the Galaxy, the overall increase to shorter wavelengths (approximately with absorption in magnitudes inversely propertional to wavelength) is interrupted by a local maximum, the so-called 2200-Angstrom bump. The rise in the SMC is steeper into the UV with no such bump. Models combining astrophysically plausible grain types have been constructed, such as the Mathis, Rumpl, & Nordsieck (1977 ApJ 217, 425) one, which puts the mass contributions of silicate and graphite (carbon) grains at 1:1. Continuing debate on what the grains in the solar system are telling us seem to be that they are not unlike those seen around young stars, at any rate, though there are hints that the small population of interstellar grains detected entering our atmosphere are unusually large and may be dominated by a single source (like β Pictoris).
Images of edge-on galaxies (and casual observation of the Milky Way) show that dust is concentrated in a fairly thick disk with very high optical depth as viewed through the plane (IR observers are fond of quoting values such as AV=40 magnitudes toward the galactic center). Still, the disk must not be very optically thick in the vertical direction, and must be patchy, by the very fact that we can see out with relative ease at high and moderate galactic latitudes. In general, what is the radial and scale-height distribution of dust, how does it relate to the spiral structure, and how does it affect the light from a galaxy's own stars and from background sources?
The classical test for effects of dust on the overall light emerging from galaxies traces back at least to Holmberg's 1958 paper, using the surface-brightness versus inclination test. For transparent galaxies, the surface brightness should vary with apparent axial ratio a/b, since the same light is concentrated to a smaller area, while if galaxies are opaque and we see only a thin skin, the mean surface brightness will be constant with inclination. Holmberg came to the reassuring conclusion that dust effects for global light were minor (though they are clearly important in some regions, as is obvious from so many images). Various correction schemes based on projected axial ratio and Hubble type were used for catalogs and correcting the Tully-Fisher relation. However, two challenges to this view arose about a decade ago. Theoretically, Mike Disney and collaborators (1993 MNRAS 260, 491) presented radiative-transfer models showing that multiple arrangements of stars and dust, some with very large overall extinction, could mimic the observed surface brightness and colors of galaxies, taking into account that strongly obscured stars don't contribute much to the overall intensity. This gives the apparent paradox (chuckled over by Witt, Thronson, & Capuano 1992 ApJ 393, 611) that dusty galaxies can be quite blue. Observationally, Valentijn (1990 Nature 346, 153) analyzed surface photometry of the entire ESO/Uppsala galaxy survey to conclude that galaxies are almost optically thick, out through the optical disk. [The astute grammarian will be able to tell from my wording how plausible I thought it was at the time, much less after working on this problem for several years.] The issue is important not "just" for understanding how galaxies work, but for the distance scale (through inclination corrections to magnitudes in the Tully-Fisher relation), understanding dark matter (if we're seeing only half the starlight, that halves the relative amount of dark matter), and the evolution of QSOs (when does the cumulative absorption along a random line of sight become so large that QSOs will disappear from optical surveys?).
A flurry of work from various directions in the 1990s addressed this whole issue of the optical opacity of disk galaxies (as described in the proceedings of the Cardiff workshop The Opacity of Galaxy Disks. There were improved statistical analyses of various surface-photometry samples, models of radiative transfer in clumpy media, (ahem) studies of overlapping galaxies, and new measurements of far-infrared and submillimeter dust emission. The upshot was the most participants in the meeting could agree with the "Welsh Model" ( I Model Cymraig), which has the disks centrally quite optically thick, falling to transparent at the edges, with dusty spiral arms and considerable varation among galaxies. Fine with me.
Detailed study of the exrtinction curve, especially in our galaxy, finds that the grain population needs components which are carbon-rich (graphite or amorphous) and silicate-rich. The largest grains cannot be much larger than 0.25 micron to avoid too much grey extinction. Condensation into grains means that these elements are depleted in the gaseous phases of the ISM, which needs to be taken into account in the chemical-abudance budget and serves as a caution in measuring abundances in distant systems (such as QSO absorption-line systems). From an old compilation by Duffey (1984 MNRAS 25, 109), about 65% of carbon is locked into grains, half of nitrogen, and most of the sodium, magnesium, silicon, and iron. Thus, measuring their gas-phase abundances in the cold gas component is not very helpful. The grain size distribution is close to a power law in size, with N(a) da ~ a-3.5, although they are not necessarily spherical. Unlike the situation with stars, this index means that the most massive grains carry most of the overall mass.
 A potential issue in certain parts of galaxies, especially the
dustier ones, is scattering. This is certainly important in a few
cases, and modelling suggests that in any sufficiently dusty
mix of stars and dust it will be, sometimes in the particularly insidious guise
of blue scattered light filling in the reddening of direct starlight.
The optical and UV continuum from the superwind plume in
M82 is scattered,
as shown by polarization, as is much of the ultraviolet emission
in parts of the LMC near luminous stellar associations. This
is shown (at right) by the polarization patterns reported by Cole et al. 1999,
AJ 118, 2280) from the
WISP sounding-rocket payload (reproduced courtesy of the AAS). The
scattering signature is the centrosymmetric pattern of
polarization vectors around the bright star-forming regions.
A potential issue in certain parts of galaxies, especially the
dustier ones, is scattering. This is certainly important in a few
cases, and modelling suggests that in any sufficiently dusty
mix of stars and dust it will be, sometimes in the particularly insidious guise
of blue scattered light filling in the reddening of direct starlight.
The optical and UV continuum from the superwind plume in
M82 is scattered,
as shown by polarization, as is much of the ultraviolet emission
in parts of the LMC near luminous stellar associations. This
is shown (at right) by the polarization patterns reported by Cole et al. 1999,
AJ 118, 2280) from the
WISP sounding-rocket payload (reproduced courtesy of the AAS). The
scattering signature is the centrosymmetric pattern of
polarization vectors around the bright star-forming regions.
Moving to the emission from grains, ground-based observations, out to the 10-micron window, only detect unusually hot dust populations, such as are associated with active nuclei, H II regions and starburst galaxies. On top of this, much of the emission from 3.5-15 microns comes from distinct broad emission bands, loosely associated with the substances known as polycyclic aromatic hydrocarbons (PAHs). These large molecules can be significantly heated by single photons, so their emission is not at a level implying equilibrium with the impinging radiation field. This in fact applies rather generally to small grains. These features, long called the UIRs or unidentified infrared bands, can be seen in this ISO spectrum of the colliding starburst system NGC 6090.
The IRAS survey showed that far-IR emission is ubiquitous among spiral and irregular galaxies, even some for which optical data suggested a very modest dust content. Some fraction of this emission is powered by young stars, making far-IR emission a very tempting indicator of star formation if we can understand it properly. For thermal emission, dust grains are heated by absorption of starlight, which operates most effectively in the blue and UV as the wavelength comes closer to the characteristic grain size. The grains cool by (approximately) black-body emission, modified by a wavelength-dependent emissivity cause largely by the fact that the grains are smaller than the blackbody peak wavelength and thus cannot radiate such wavelengths as efficiently as a perfect radiator. The peak emission typically correspond to a blackbody temperature 20-40 K; a significant range must be present to account for the far-IR spectral shapes. The recent advent of ISO 200-micron and ground-based submm measurements allows (and dictates) the inclusion of components slightly above 10 K, which are important out to 800 microns. In fact, this cold dust is dominant by mass over the much brighter dust seen out to 100 microns. The components are sometimes attributed to different regimes of heating: environments of OB stars, regions near cooler stars, and so-called infrared cirrus emission from a widely distributed grain population heated only by the average ambient stellar radiation field. Note that the interpretation of mid-IR (10-micron) emission is complicated by the small grain sizes; such a grain may absorb a single UV photon and be heated well above the equilibrium temperature for the radiation field, thus emitting at a temperature well above that appropriate to its location.
Exact interpretation of the UV-optical-IR energy balance is incredibly
messy, requiring knowledge of the exact distribution of various stellar
types and grain populations. Global considerations are more interesting.
That is, the total energy removed by dust absorption in the visible and UV
must emerge in the far-IR. For some galaxies, most of the UV light is
absorbed by dust (just how much is a matter of, er, heated debate).
In this case, the luminosity from 10-300 microns equals that emitted from
912-3000 Angstroms or so. Empirically, there is a tight relation between total
far-IR emission and
H This has been used to calibrate relations between FIR luminosity and SFR,
but there are important uncertainties - how many ways are there to heat
dust grains? And just which stars are doing the heating? In most
galaxies, the SFR changes slowly enough conmpared to the lifetimes of hot
stars that you'd expect similar correlations with indicators of
stars having lifetimes up to a Gyr.
There remains controversy as to whether young stars
are the dominant heating mechanism, or whether there is a significant
contribution from older, cooler stars. The widespread existence of
infrared cirrus in our own galaxy suggests that some emission,
especially at cooler temperatures, arises in very extensive clouds of
dust (frequently associated with H I in the Milky Way) that are
illuminated and heated by the ambient, general stellar radiation
field. These clouds were in fact first found as faint optical
reflection nebulae, lit up by the general light of the galactic plane
(Sandage 1976 AJ 81, 954). The existence of very cool components in some
galaxies' far-IR and mm spectra indicates that such dust is
common. In calculating the dust mass, it becomes important that the grains
are much smaller than the wavelengths of peak emission. This means that
the expected blackbody spectrum is modulated by an efficiency or
emissivity function, expected to lie between
1/λ and
1/λ
2. This value has been so far determined empirically,
from the shape of the long-wavelength tail of the spectrum (especially
from reflection nebulae which can be modelled in detail). For whole galaxies,
values of the exponent near -1 fit well. The resulting total dust
masses are typically 107 solar masses for spirals,
a small fraction of the total ISM mass. As a first approximation,
the gas-to-dust ratio seems similar among spirals, at about 0.5% by mass.
This was not true
for dust masses derived just from IRAS data ignoring cooler dust
(as discussed by, for example, Block et al. 1994, A&A 288, 383). Despite the evidence for cooler dust components, Devereaux and Young
especially have argued that the
strong correlations among total far-IR emission,
Hα emission,
and CO vs. total gas mass are too tight to allow much of a role for
any far-IR component not strongly linked to the current star-formation
rate. Perhaps the SFR changes slowly in most galaxies, so that only
the proportionality constant in these relations (and their scatter)
tell us exactly how much of the far-IR is powered by current formation
of massive stars. The CO-FIR relation is illustrated by
Fig. 7 of the review by Young and Scoville 1991 (ARA&A 29, 581,
reproduced from the ADS), with the CO data transformed into
H2 masses: In a skeptical vein, Kennicutt (in The Interstellar Medium in Galaxies,
Kluwer, 1990) points out that the same
CO-FIR relation is also followed by a burning cigar, his Jeep, the
Yellowstone forest fire, and the observable Universe. This may be another
manifestation of the well-known astrophysical principle that big galaxies
are big and little ones are little, so that differences among scale-linked
properties are second-order effects. Ultraviolet observations of the stellar population also provide important
clues to the contentious issue of grain heating - what kinds of stars
are most responsible for heating the various populations of grains
that are observed radiating in the mid- and far-infrared? Global
correlations have been interpreted as evidence that OB stars play
a dominant role in most spirals (e.g., Devereux & Young 1990
ApJL 350, L25),
but Galactic infrared cirrus
cautions us that the diffuse radiation field of older stars (peaking
in the optical or near-IR) may be important. The basic approach here
is straightforward enough, assessing whether the dust emission or
color temperature correlates more strongly with one stellar population or
another while being sure that the resulting scheme satisfies conservation of
energy, but the application is in practice more subtle. The analysis
must avoid circular reasoning; if the dust is too effective at absorbing
UV photons, the stars responsible will certainly not appear as ultraviolet
sources in our census. This means that one must consider whether the
dust emission shows peaks in intensity or temperature which suggest
embedded heating sources. A powerful recent example of such a study
is the Pagani et al. (1999 A&A 351, 447) comparison of the distributions of
2000-Angstrom flux, H I column density, and mid-IR emission features in
the southwest arm of M31, which shows that the IR emission attributed to
aromatic molecules traces the gas very well, and the putative UV heating
sources poorly, suggesting that these giant molecules (or miniscule grains)
are mostly heated by the ubiquitous diffuse starlight from the older
populations. The increase in extinction (i.e. combined absorption and scattering)
going into the ultraviolet means that the realistic effect of dust
on a galaxy in the UV is what has been called a picket fence.
That is, either objects are substantially unreddened or they
disappear, since the column density range corresponding to slight
UV extinction is so small. As an example, here is a UIT image
of the core of M33 at 2400 Angstroms (blue) overlaid on a
red-light image. Not only do the UV-bright associations avoid
discrete dust features, but there is an overall asymmetry probably
related to looking at the inside and outside of spiral arms
on different sides of the nucleus. The effect is so strong that
one would miss the position of the nucleus from the UV image alone.
This is a cautionary example, that dust affects the younger and more
concentrated parts of the stellar population preferentially. Understanding differences among dust properties in various
galaxies is still pretty primitive. We do see differences between
the Milky Way, LMC, and SMC, likely driven by metallicity. Andromeda
and a few other
luminous spirals with decent data show reddening
curves much like the Milky Way, with weak evidence for different
strengths of the 2200-Angstrom feature between our galaxy and M31
(Bianchi et al. 1996 ApJ 471, 203).
One study has used differential reddening between the images of
gravitational lenses to look at reddening curves, and even to
extract redshift estimates from the slopes (Falco et al. 1999 ApJ 523, 617).
Whether grey
(wavelength-independent) extinction exists is important for
the issue of a nonzero cosmological constant, since such dust
would dim supernovae without the expected accompanying reddening. The universality (or otherwise) of the extinction curve makes a huge
difference for how strongly we can correct for dust effects. Baade
is said to have been asked late in his life whether he would make the
same career choices over again - "Only if the ratio of total to
selective extinction is everywhere 3". In addition to the spectroscopic
techniques mentioned above, this issue can be addressed through a
ganeralization of the overlapping-galaxy technique. Given a dust cloud
which is well resolved and contains regions of a wide range of optical
depth, comparing the intensities in multiple bands point-by-point
can separate the effects of foreground starlight from the shape of
the reddening law. Here is an example, fitting various values of
R to the reddening law of a dust patch in NGC 1316. The amount of
foreground starlight anchors the lower end of the curve family;
in this case, the curves correspond to R=1.4 (top) to 2.4 (bottom);
unresolved mixtures of law and high opacity will make the extinction
appear greyer (R larger) than the intrinsic grain properties. This
kind of analysis indicates that red extinction (small R) is common
in the bulges of spirals and in the cores of ellipticals.
 An example of mid-IR galaxy structure (which is thought from the few
well-studied
examples to be a good proxy for FIR appearance) is this 15-micron image of
M51, from
an ISO WWW press release. Many of the H II regions and young star clusters
are prominent sources
in the thermal grain emission, as one might expect. Perhaps more
important is the small number of sources with no obvious optical
counterpart, marking deeply obscured star-forming regions which
don't appear in
Hα
or UV censuses. Recent
Herschel observations
have given comparable angular
resolution in the far-IR, so a comparison of various grain populations
at different temperatures is much easier:
An example of mid-IR galaxy structure (which is thought from the few
well-studied
examples to be a good proxy for FIR appearance) is this 15-micron image of
M51, from
an ISO WWW press release. Many of the H II regions and young star clusters
are prominent sources
in the thermal grain emission, as one might expect. Perhaps more
important is the small number of sources with no obvious optical
counterpart, marking deeply obscured star-forming regions which
don't appear in
Hα
or UV censuses. Recent
Herschel observations
have given comparable angular
resolution in the far-IR, so a comparison of various grain populations
at different temperatures is much easier: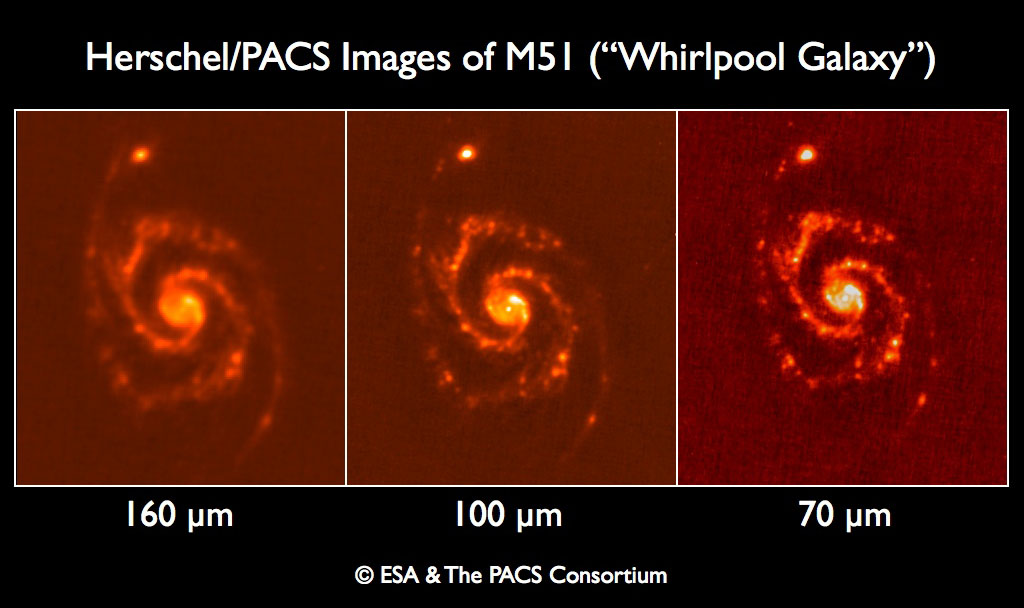
Last changes: 9/2006 © 2000-6