You'll work from dark-subtracted FITS images (which we should have' saved that way at the telescope). You need at least 2 different filters (from B,V,R, for example), and better three. This writeup goes through the process using the Iris program by Christian Buil (which is freeware available from http://www.astrosurf.org/buil/us/iris/iris.htm).
Open each image you need to work with in Iris (File-->Load). The program may or may not automatically select a useful display mapping from the data numbers in the display to brightness on your screen (and the same display may not be equally useful for all stars in an image). The THRESHOLD box deals with this, letting you set the data values corresponding to black and white. Start with AUTO, and change top/bottom sliders for black/white levels to get something more informative.
I favor matching the telescope display and maps by flipping the image north-south to put north at the top. This uses Geometry-->Flip-->Horizontal (I would have thought "vertical"; maybe it's a French translation issue).
Make a hardcopy (say through the File-->BPM Conversion tool and some image display program) to keep track of which star is which. It may be easier on the printer and your marking if you set the contrast to negative (black stars on white sky) before output for printing. This picture may be the only way you have to be sure you can associate the different files' data on each star with each other.
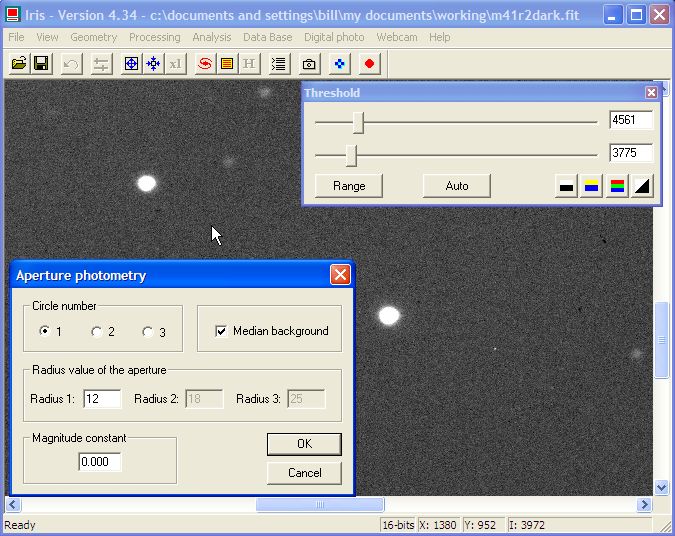
To measure the stars, use Analysis-->Aperture Photometry (this only works in 1x zoom, Iris reminds you if you need to change). You need to set three radii for these measurements. Radius 1 is for the circle within which the starlight is added. Radii 2 and 3 define the annulus where sky light is subtracted. Radius 1 should encompass all the detected light of a bright star. (screenshot)
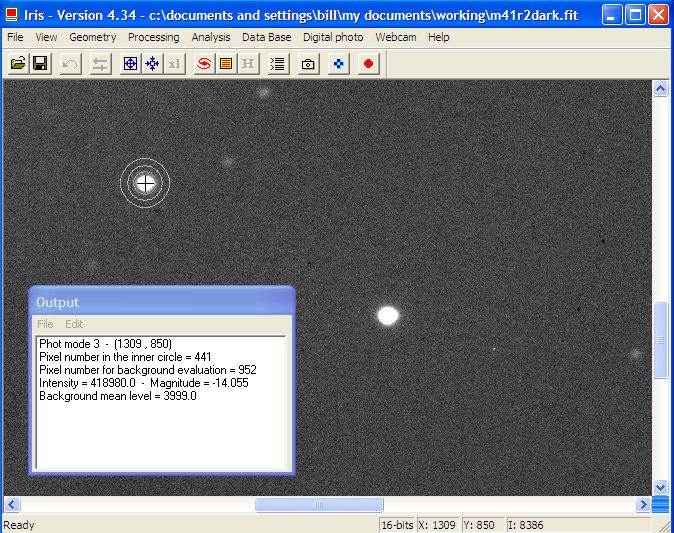
Now each point-and-click on a star adds the data to a log window. (screenshot). From this, you can copy/paste the magnitude values to a text file or spreadsheet (I find that this window only allows a single line to be copy/pasted; you can also save this whole log as a text file and merge the different filters by hand, keeping track again of which star is which. The (x,y) coordinates will help!). Eventually, you'll need data for each star lined up for arithmetic in a single row.
The advantage of using a star cluster for the H-R diagram is that all its stars are at essentially the same distance from us, so that many important features can be seen by plotting observed magnitudes rather than needing to estimate individual distances for each star. As you look fainter and fainter, into the cluster's stars, there will be more and more interloping foreground and background stars at other distances that will scatter across your HR diagram, so it may be progressively less clear where the cluster features are at faint levels. The observational H-R diagram plots a color measure (B-V or B-R magnitude differences) horizontally and the star's magnitude vertically (with bright stars, that is, numerically small magnitudes, at the top). Excel seems not to want to do this unless you multiply the magnitudes by -1. You should look for the main sequence sloping from bright and blue to faint and red, and some red giants. Make note of the color at the top of the main sequence, which can give an estimate of the cluster's age.
The following table gives rough lifetimes on the main sequence for stars of various spectral types and colors. You can compare these to the color of the top of the main sequence in your cluster to estimate its age. (Note that we are ignoring for now the reddening produced by interstellar dust, so these ages will be too large).
| Spectral type | B-V | Lifetime |
| O | -0.4 | 1 million |
| B | -0.2 | 30 million |
| A | 0.2 | 400 million |
| F | 0.5 | 4 billion |
| G | 0.7 | 10 billion |
| K | 1.0 | 60 million |
| M | 1.6 | 100 million |
Last changes: 4/2005