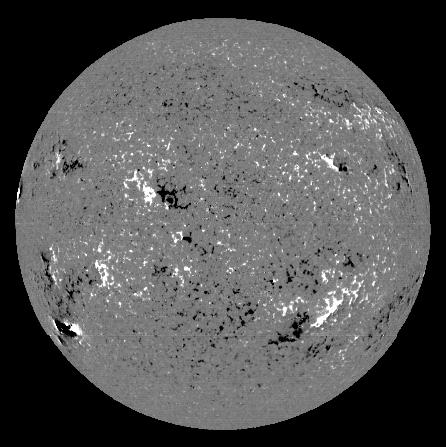
Magnetogram for July 18, 1990 (NSO)
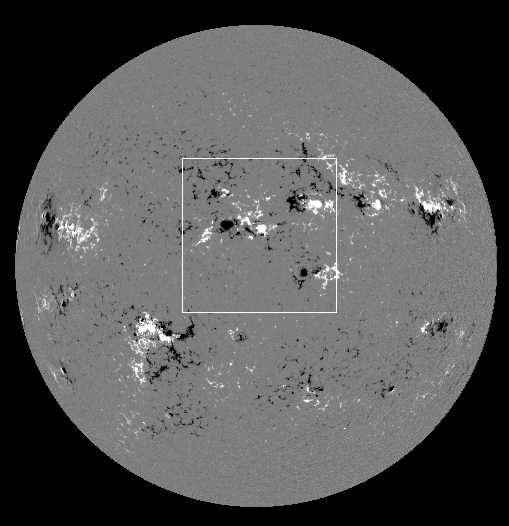
Magnetogram for July 18, 2000 (SOHO)
|
|
|
|
Magnetogram for July 18, 1990 (NSO)
|
Magnetogram for July 18, 2000 (SOHO)
|