Motivation: With abundant evidence that the overall star-formation rate has changed with cosmic time, we expect to see low abundances of heavy elements in the early Universe, before most stars had formed, much less been able to enrich their surroundings with processed elements. In principle, abundances give us a new way to trace the overall history of star formation, one which could be important to the history and heating of both the intracluster and intergalactic media. The relation to star-formation history may not be trivial, since there is good reason to believe that outflows were common in many galaxies early on in their evolution. This implies that some enriched material has left the galaxies and no longer participates in their internal star/gas cycling. The history of this material can, to some extent, be picked up as part of the ICM.
Approaches: Our favorite ways of measuring chemical abundances, using absorption-line strengths and modelling of stellar atmospheres, usually in whole populations, won't work at great distances. The systems are very faint for absorption-line work, and the familiar emitted optical spectral regime is shifted into the near-infrared so that the ground-based sky background becomes very bright. We can, however, use several more or less direct approaches to see whether high-redshift galaxies really do have lower metal abundances than their nearby counterparts.
Ultraviolet spectral slope. Calzetti et al. established an empirical relation between the slope of the continuum in the 1200-2000 A ultraviolet (beta, as the log flux-log wavelength slope) and metal abundance O/H as determined from optical emission lines. Within the error bounds of its scatter, we can use this relation to ask what range of O/H could give the very blue continua seen in compact high-redshift objects (especially our sample with strong narrow Lyman alpha). The results show that they must have quite low O/H, several times lower than nearby objects of comparable luminosity.
Redshifted optical emission lines. Observations of nearby H II regions show a workable relation between metallicity and the ratios of strong optical emission lines (starting with Pagel and Edmunds), which can now be applied to galaxies at large redshift by near-IR spectroscopy. In some cases the application has to be really primitive, using just the [O III]/H-beta ratios or lower limits on it. Except for very low abundances, the line ratio is inversely correlated with O/H, a paradoxical situation which comes about because oxygen is important in the gas cooling and the forbidden line has an exponential-like dependence on temperature. Thus, at high abundance the cooling is very effective, the electron temperature is low, and the upper level for this line is excited with very low efficiency making the line very weak. An example from the ESO VLT shows strong [O III], but undetectable H-beta, in a Lyman-break galaxy at z=3.0

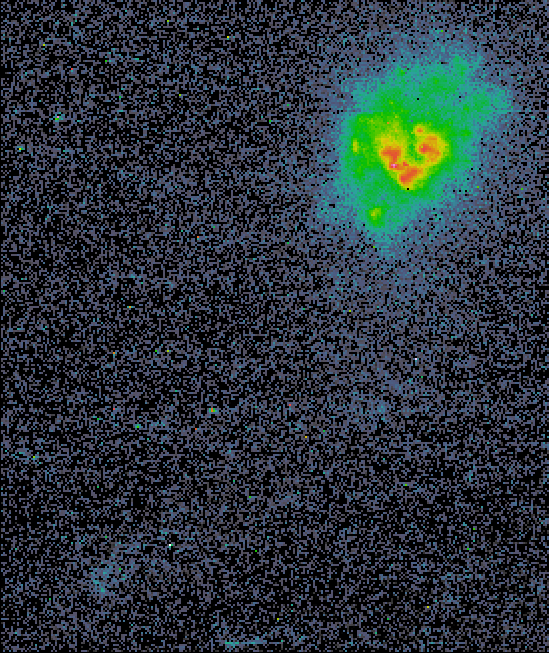
Lyman alpha emission. Resonant scattering says that low dust abundance helps the photons escape, but so do large velocity gradients. Outflows are favored, especially for emission from the back side, on small scales. New HST observations of a starburst system, Mkn 357 at z=0.057, tell a similar story on large scales, and confirm suspicions from M33 Voyager data that this line is seen mostly from the diffuse ISM rather than individual star-forming regions. This is important since many high-z objects are strongish Lyman alpha emitters. The Mkn 357 data include a slitless spectrum around Lyman alpha, a deep-UV direct image, and optical images in H-alpha and the R band. Comparisons of these show that:
 |
 |
Taken together, these results indicate that the Lyman-alpha emission comes from the diffuse medium, that this diffuse medium is mostly in a global starburst wind, and that the escaping photons are from the receding side of this wind. This, by implication, adds to the evidence that many of the high-z galaxies with strong Lyman alpha emission are blowing winds as well. Lyman-alpha asymmetries and differences from redshifts measured from near-IR (formerly optical) lines support this idea.
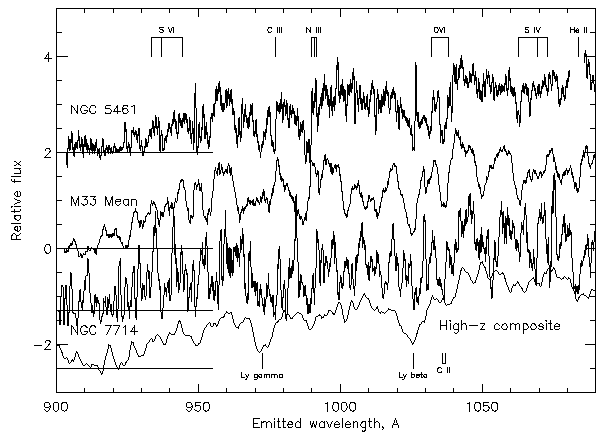
Far-ultraviolet spectral morphology. The range between Lyman alpha and the Lyman limit (912-1216 A, 10.2-13.7 eV) is the last we see at high z until it vanishes into the Lyman alpha forest. This is a very rich range, with many strong resonance lines of important elements. Stellar winds are a big issue in shaping this part of the spectrum via P Cygni profile. This complication actually strengthens the dependence on abundances, since the winds are radiatively launched and depend strongly on metallicity. This could lead to fairly low-resolution techniques to get metal abundances. To look at this, older Voyager data have been followed up with FUSE spectra of the four brightest giant H II regions in M33, plus the starburst nucleus of NGC 7714 and an outer H II region in M101. Comparison of the M33 regions with a composite of galaxies at z=3.4 from Steidel et al. shows that the Lyman absorption lines are present in both, but that the P Cygni wind lines are weak or absent at high redshift. The stellar populations should not be too different simply because of the short lifetimes of B stars which dominate in the far-UV, so this may be a genuine composition difference.
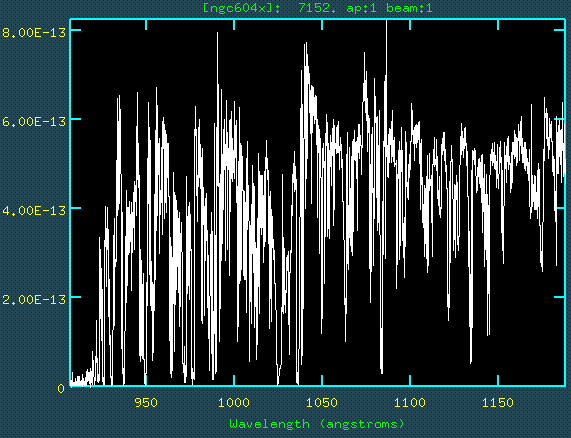
The richness of the spectrum is shown by this observation of NGC 604, probably the brightest H II region in the Local Group. As they used to say in the Lyman-alpha forest business, that's not noise:

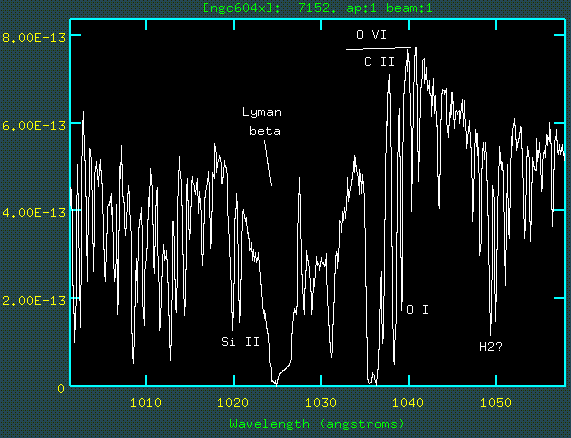
The level of detail in these spectra (which we are not using anywhere close to the actual wavelength resolution of FUSE) can be seen in this expansion of the area from 1000-1050 A, including Lyman beta and the O VI pair as P Cygni lines. Many of the other narrow features are reproducible, also seen in earby hot stars from the ISM, and otherwise unidentified. We're working on it...

A first comparison of the high-z composite and the FUSE data shows the metallicity-linked differences:

Last changes: November 2001