(a WWW version of a talk presented at the summer 1997 meeting of the American Astronomical Society in Winston-Salem)
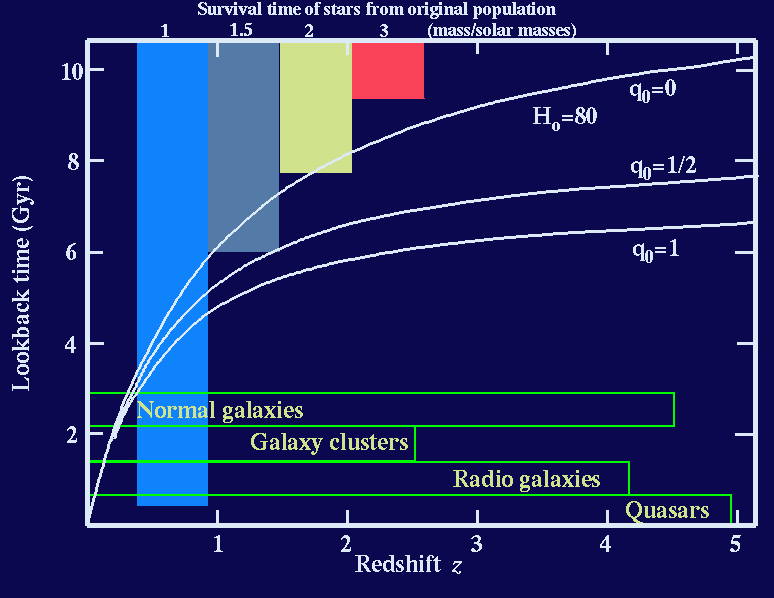
A major question in galaxy evolution is "When did spheroids form?" - that is, how old are elliptical galaxies and the bulges and halo populations of spirals? A direct approach has recently become possible - study of the stellar populations of galaxies at large redshifts and hence large lookback times. This figure, adapted from one in Don Hamilton's Ph.D. dissertation in 1985, shows how much leverage we can get in this way - even a crude age measurement at high enough redshift is a very strong constraint on galaxy ages today.
The color bars coming down from an assumed formation redshift show how long stars of various masses formed in an initial burst would have survived, and thus how far back we need to look to see more and more of the initial population. There have been numerous attempts to measure the expected evolution of the reddest (generally E/S0) galaxies, usually starting from colors or the amplitude of the 4000-Angstrom spectral break. The item of interest is the red envelope (in this case, locus of the strongest 4000-A break) versus redshift. This plot compares a sample of nearby elliptical radio galaxies, the reddest faint field galaxies, and a sample of low-power B3 radio galaxies at redshifts z near 1. The curves are predictions of a simple Bruzual/Charlot model with only an initial burst of star formation.
Only recently, with the advent of the Keck telescopes, has it become possible to examine galaxy spectra in the redshift range z=1.1-1.5 in enough detail to estimate ages through comparison with evolving models. At higher redshifts, we are still driven to use broad-band optical and near-infrared data in comparison with the models. We have been working on a cluster of objects at z=2.4 observed with HST. (This has been work carried out in collaboration with Rogier Windhorst and Sam Pascarelle at Arizona State; I prepared some supplementary material on this). The cluster members were selected from Lyman-alpha emission (thanks to a fortuitous match between its wavelength at this redshift and a narrow-band WFPC2 filter). These objects are faint (V=23 for the brightest active nuclei in the cluster), small (effective radii 0.1 arcsecond, about a kiloparsec at that redshift), and undistinguished. How undistinguished may be seen from this color composite of the WFPC2 field, as detailed in the STScI press release of September 1996. Tough to find them without the numbers.
We have been supplementing the HST data with near-IR images from the NASA Infrared Telescope, both to measure their optical-IR (which was, when emitted, UV-optical) energy distributions and measure their H-alpha emission. This (messy) diagram shows the broadband energy distributions of the cluster members; the three known AGN all fall at the top, so concentrate on the others. The short lines are for objects that we haven't yet measured at the K band (2.2 microns).
The superimposed spectra are for nearby starburst galaxies (from an atlas of matching UV and optical data produced by Anne Kinney and co-workers). These are the most like what we see at high redshifts, a much better fit than either single-age fading burst models or constant-star-formation-rate schemes. Our best-estimate age for these object is 300-500 million years as observed. Further observations are in progress; specifically, this region has been mapped by ISO at 8 microns, to measure the coolest stellar populations, and grism observations are scheduled with NICMOS (yes, camera 3, we think a refocus campaign is a very good idea!)
Back to Bill Keel's home page
Last updated: 27 June 1997