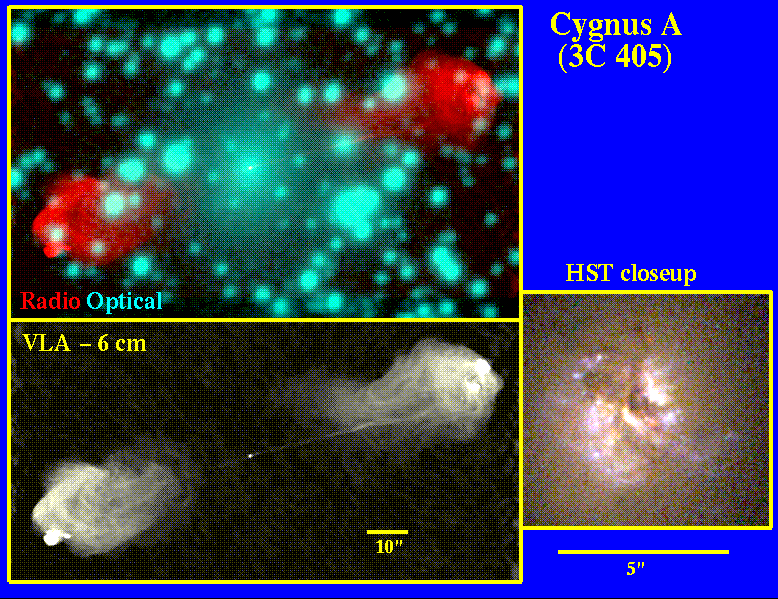
This is the most powerful radio galaxy on our corner of the Universe, used as a point of departure for studying radio galaxies at great distances. At a redshift z=0.0565 (distance of about 211 Mpc or 700 million light-years), its nature remains mysterious enough. The first photographs of Cygnus A showed two clumps of luminous material, which led Walter Baade and Rudolph Minkowski to speculate that the radio emission was somehow linked to a galaxy collision. Others saw a poorly resolved version of Centaurus A, bisected by a thick dust lane. The HST image shown as an inset reveals much detail, but doesn't quite clear the matter up. We see dust and an odd Z-shaped pattern. Much of this light in some regions comes not from stars, but from gas ionized by the nucleus. This is a narrow-line radio galaxy, but infrared and polarization measurements show that from some directions it would appear as a broad-line object and perhaps as a quasar, so that there is plenty of radiation in some directions to light up the gas.
Cygnus A is an excellent example of the Fanaroff-Riley (FR) type II radio sources, characterized by faint, very narrow jets, distinct lobes, and clear hot spots at the outer edges of the lobes, often where the jets intersect the outer edges. These are in general more powerful radio sources than the FR I objects seen in slide 13, with the difference being frequently attributed to faster (relativistic?) motion of the jet material in the stronger FR II sources. The radio/optical overlay highlights the extent of the radio source beyond the central galaxy, extending 140 kpc (500,000 light-years) if we see it sideways.
Bob Fosbury provided the HST color composite image. The wide-field optical image was taken with the 0.9-m telescope at Kitt Peak National Observatory, courtesy of Frazer Owen (as described by Owen at al. 1997 in ApJLett 488, L15). The VLA map is from the NRAO CD-ROM "Images from the Invisible Universe", as presented by Perley, Dreher, and Cowan 1984 (ApJLett 285, L35). For the overlay, both optical and radio images were displayed with logarithmic intensity scales.