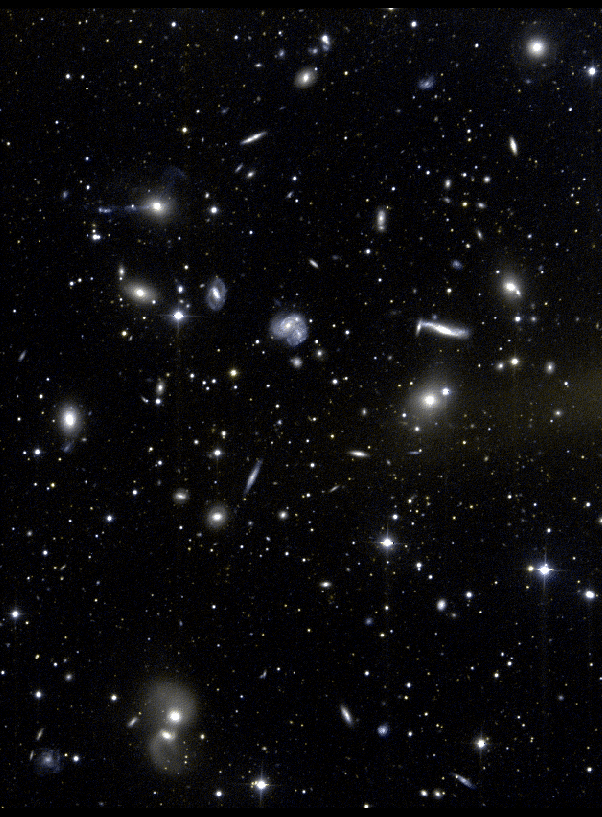
 A nearby spiral-rich irregular cluster of galaxies.
This cluster, Abell 2151 in Hercules, is the prototype
spiral-rich cluster. It is not as rich in galaxies, nor
as centrally concentrated, as the Coma cluster. Clusters
of this kind may be rich in spiral and irregular galaxies,
and in Abell 2151 we see many interacting galaxy pairs and
small groupings of galaxies. In both the dynamics of
the cluster and its galaxy population, it may be possible to
view Hercules as less evolved than Coma. Recent observations
show that many Coma-like clusters seen at higher redshifts
(and thus as they were several billion years ago) have galaxy
populations much like we see today in the Hercules cluster,
with numerous spiral and interacting galaxies. Some combination
of interactions, mergers, and effects of intracluster gas
may be driving this change with time.
There is a rich variety of phenomena evident in this image. Spirals and elliptical or S0 galaxies show a clear distinction in color, with the blue star-forming disks of spirals contrasting with the neutral or yellowish tint of older populations of stars. Interactions can be seen among spirals (as in the pair NGC 6050/IC 1179 partially overlapping above center) and among ellipticals (as in IC 1178/1181 at the lower right corner). Tidal distortions of ellipticals are much broader and smoother than one finds in spirals. An extreme interaction is seen in IC 1182 at upper left, with a long blue tidal tail and shell of evidently accreted stars and gas. The edge-on "integral-sign" galaxy NGC 6054 may show a warped disk resulting from a past interaction. Many of the faint, diffuse blue galaxies have been detected as neutral-hydrogen clumps, in a survey by John Dickey of the University of Minnesota using the Very Large Array.
The image is a color composite produced from CCD images in blue and red light, taken by Victor Andersen using the 0.9-meter telescope at Kitt Peak National Observatory and a 2048x2048 Tektronix CCD. The field shown here is 19.1 arcminutes tall, with north at the top and east to the left. A logarithmic intensity scale has been used to compress the brightness range for display.
 UA Astronomy Home Page
keel@bildad.astr.ua.edu
 Last changes: September 2002